A little over a year ago, I started a deep dive into my record collection (the actual vinyl part of it to be precise). (Part 2 is here.) And while this exercise yielded some valuable insights into the type of music I own, and by extension listen to every day, the analysis was a bit too blunt for my liking. With that in mind, I thought I would revisit it a year on.
Performing this analysis on my digital collection would be incredibly daunting for a couple of reasons. First, the sheer scale of my digital music is a much larger sample (approximately 40k songs and 212 MB). And second, the metadata for a lot of my collection is a bit all over the place, despite my best efforts to keep it accurate and up to date; some of the outlets (and artists themselves) obviously don’t make accurate metadata a big priority.
In the last year, I’ve acquired a lot of new records, most of which are rather recent. I also upgraded my turntable and had to swap out equalizers (they are vintage 80s equipment after all). More importantly for the sake of this analysis, I dusted off some of the Excel skills that I had almost forgotten (hooray for Pivot Tables), which is the most germane part of this discussion.
While the previous posts had looked at the records by year and genre at a very high level, I thought it would be fun to actually see the distribution of my collection over time at a much more granular level, irrespective of genre.
The following chart presents my collection by the number of records by the year of their original release. This excludes my classical records (about 30 to 40 releases) for obvious reasons.
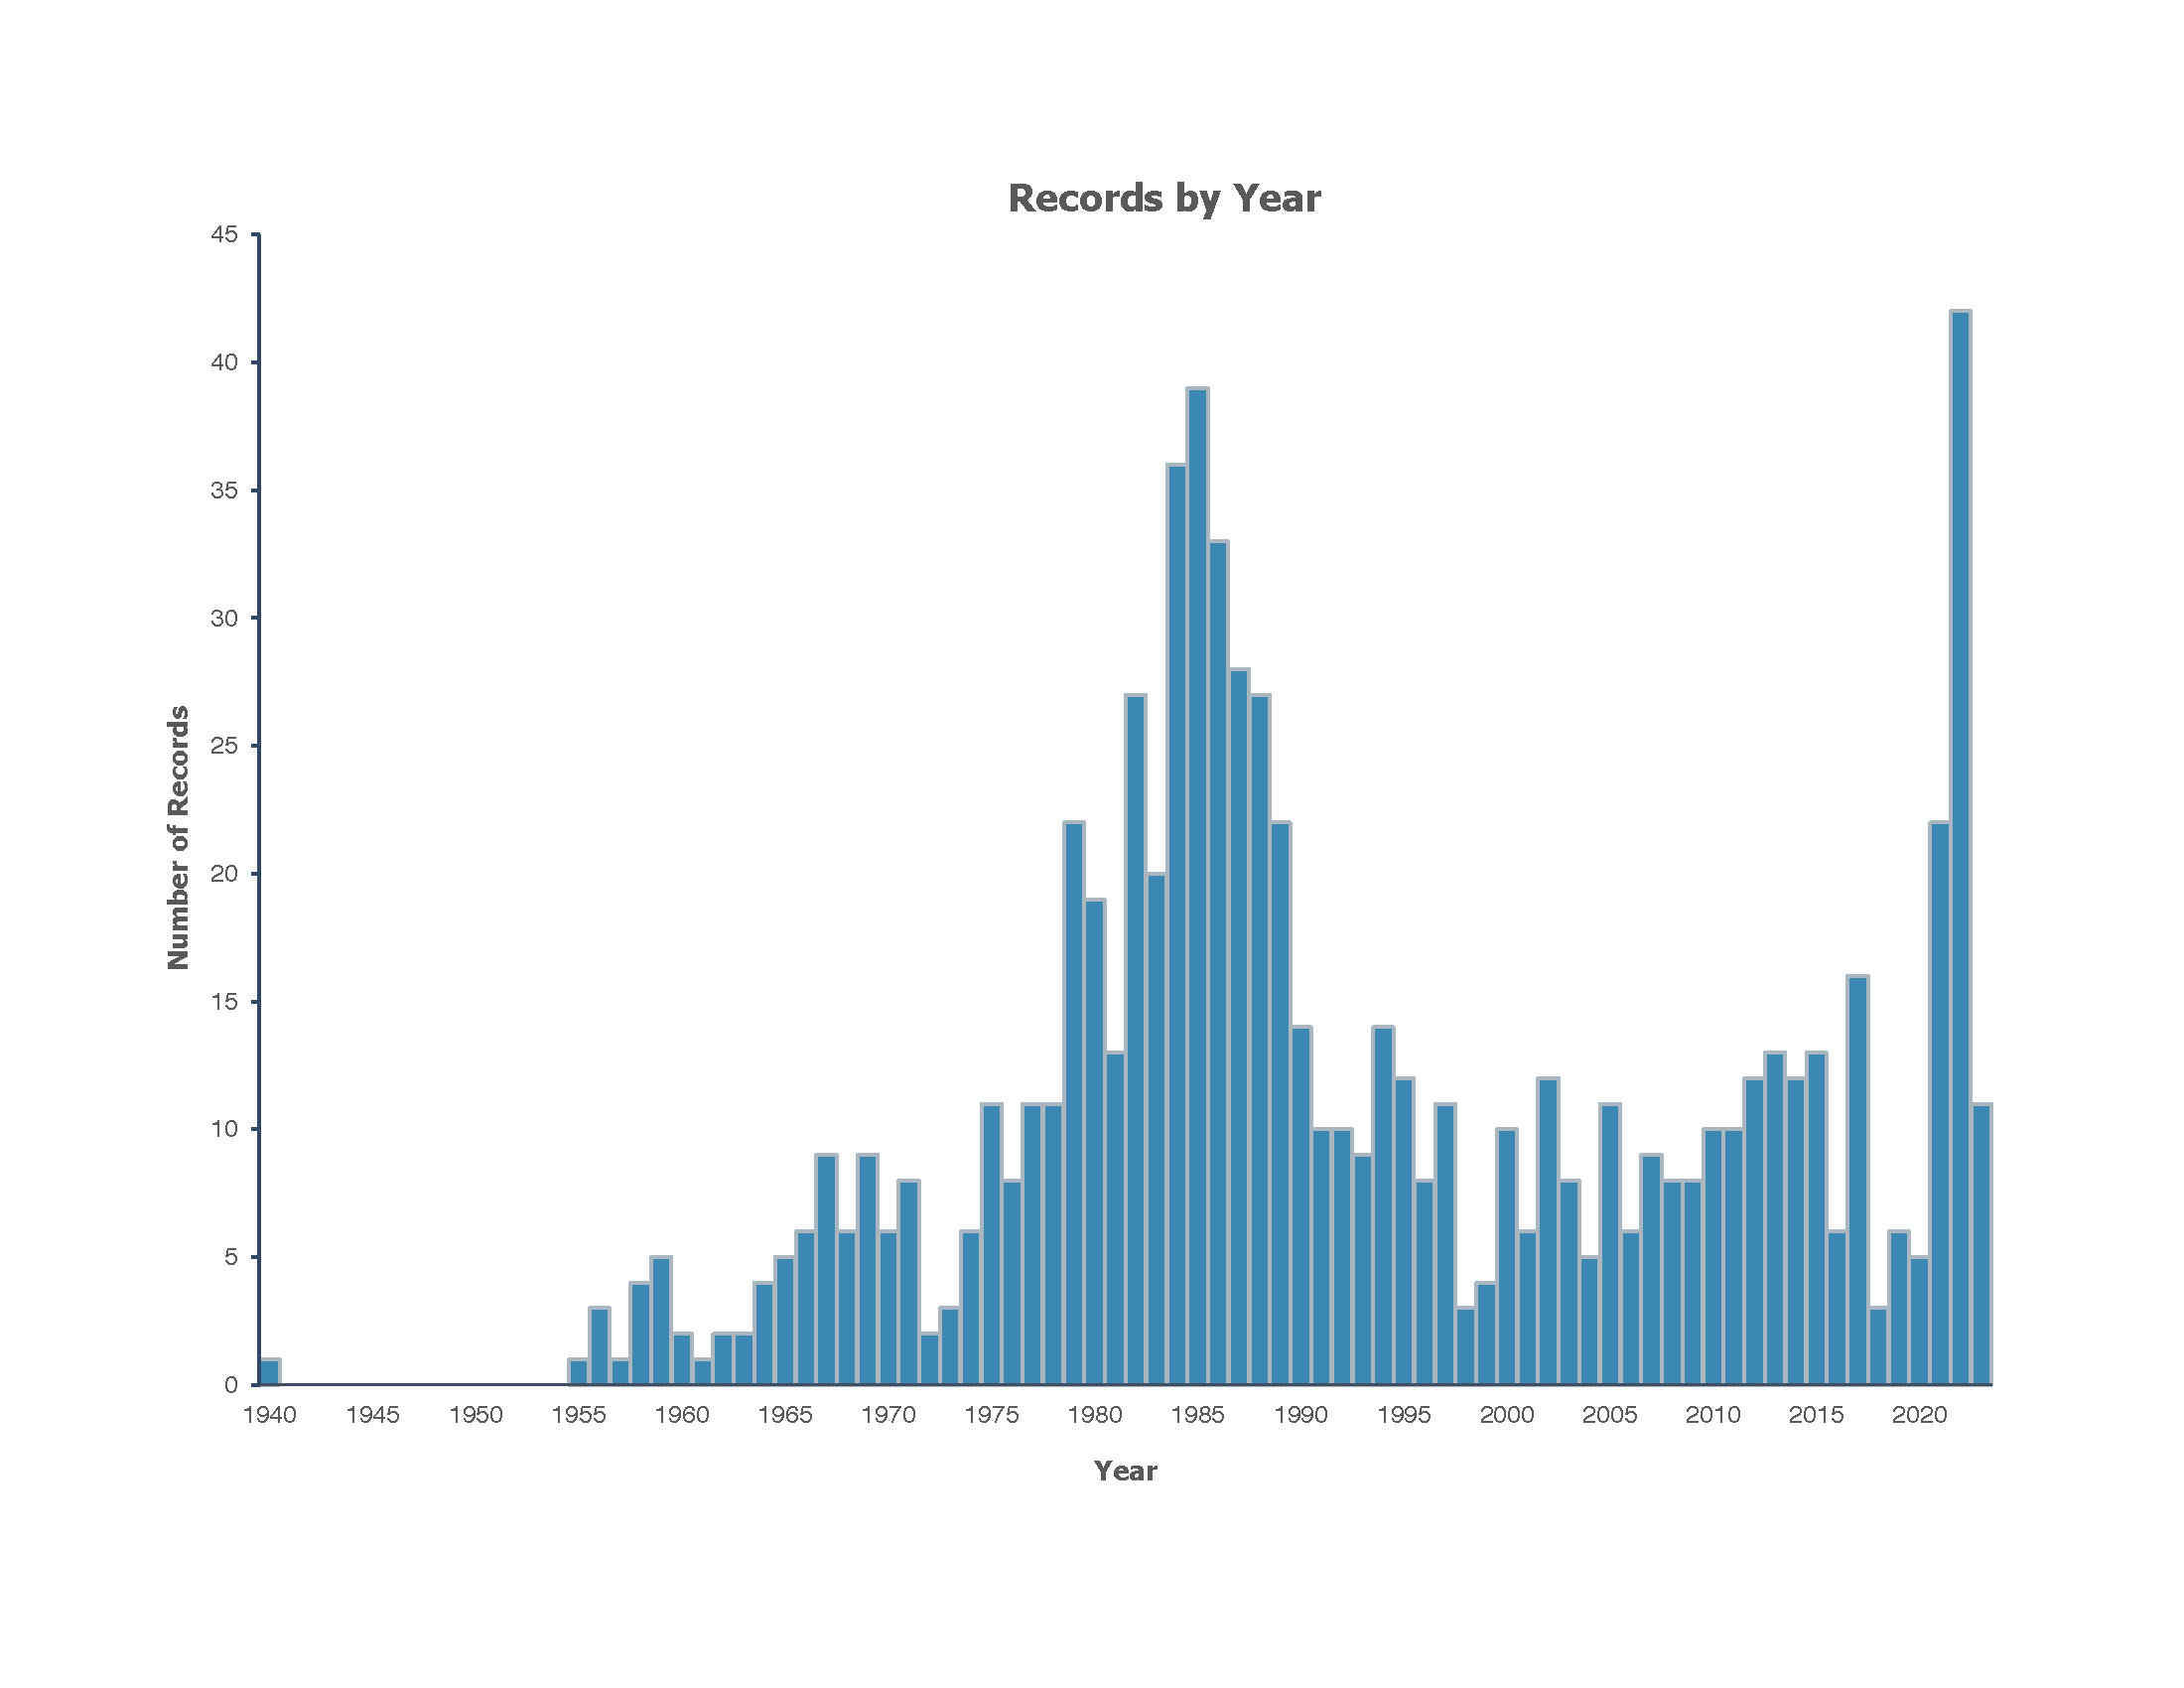
Based on my earlier analysis, there are really no surprises here. The records from the 50s and early 60s is mostly Jazz. From about 1966 onward, the records are mostly rock or country and bluegrass.
Most of my records by this metric are from either the mid-80s, no surprise there, or the last few years. This may surprise a lot of people, but these days, if I really like an album, I’ll buy the actual vinyl version of it, and some subscription services that were gifts only have made this trend more obvious. I’m not sure why there is such a dip around 2008 – 2020 as I was still very actively listening to, and seeking out new music.
Similarly, the dip in 1971 and 1972 seems a bit weird to me too.
Finally, as I alluded to in the previous posts, that dip in the late 90s is just reflective of the state of music at the time. Around then, I had almost given up on new music. It took the indie explosion of the early 2000s to rekindle my interest in new music (getting my first iPod didn’t hurt either—I mean I had to fill that bad boy up, right?).
This may interest exactly no one but me, but it was a fun exercise that took me a lot less time than I expected.